E-waste is one of the fastest-growing waste streams in the world, driven by higher electronics consumption, shorter device lifecycles, limited repair options, and expanding electrification. The latest global data shows that e-waste generation reached 62 million tonnes in 2022 and is projected to climb to 82 million tonnes by 2030, while formal collection and recycling are not keeping pace.
e-waste statistics
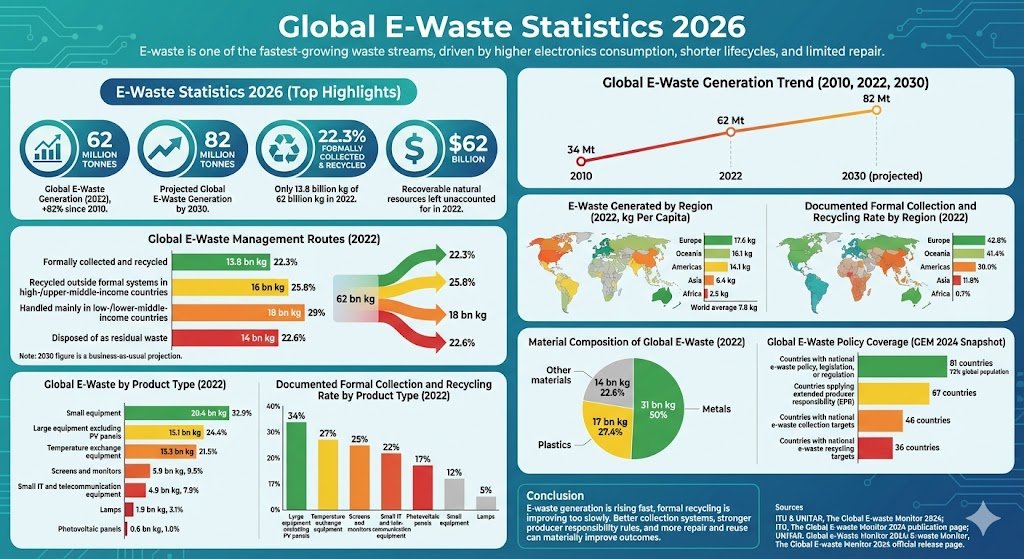
E-Waste Statistics 2026 (Top Highlights)
Global e-waste generation reached 62 million tonnes in 2022, up 82% from 2010.
Worldwide e-waste is projected to rise to 82 million tonnes by 2030.
Only 22.3% of global e-waste was documented as formally collected and recycled in 2022.
That means just 13.8 billion kg of the 62 billion kg generated in 2022 entered documented formal collection and recycling systems.
Small equipment was the largest e-waste category in 2022 at 20.4 billion kg.
Europe generated the most e-waste per capita at 17.6 kg and also had the highest documented formal collection and recycling rate at 42.8%.
Africa generated 2.5 kg of e-waste per capita in 2022 and had the lowest documented formal collection and recycling rate at 0.7%.
81 countries had a national e-waste policy, legislation, or regulation in place in the GEM 2024 snapshot, covering 72% of the global population.
Recoverable natural resources worth about US$62 billion were left unaccounted for in 2022.
Only about 1% of rare earth element demand is currently met by e-waste recycling.
Global E-Waste Generation Trend (2010, 2022, 2030)
Global e-waste generation has risen sharply over the last decade and is still climbing. The world generated 34 million tonnes in 2010, 62 million tonnes in 2022, and the total is projected to reach 82 million tonnes by 2030.
Note: The 2030 figure is a business-as-usual projection from the Global E-waste Monitor 2024.
Global E-Waste Management Routes (2022)
Most e-waste in 2022 was managed outside documented formal collection and recycling systems. Only 13.8 billion kg entered documented formal recycling, while large shares were recycled outside formal systems, handled mainly in low- and lower-middle-income settings, or disposed of as residual waste.
Label
Bar
Value
Formally collected and recycled
13.8 bn kg
Recycled outside formal systems in high-/upper-middle-income countries
16 bn kg
Handled mainly in low-/lower-middle-income countries
18 bn kg
Disposed of as residual waste
14 bn kg
Max = 18 bn kg Widths: 13.8 bn kg = 76.67%; 16 bn kg = 88.89%; 18 bn kg = 100.00%; 14 bn kg = 77.78%
Note: This breakdown shows why formal recycling figures capture only part of the global e-waste flow.
E-Waste Generated by Region (2022, kg Per Capita)
Regional e-waste generation per person varies widely. Europe, Oceania, and the Americas generate much more e-waste per capita than Asia and Africa, reflecting higher consumption levels and broader access to electrical and electronic equipment.
Label
Bar
Value
Europe
17.6 kg
Oceania
16.1 kg
Americas
14.1 kg
Asia
6.4 kg
Africa
2.5 kg
Max = 18 kg per capita Widths: Europe = 97.78%; Oceania = 89.44%; Americas = 78.33%; Asia = 35.56%; Africa = 13.89%
Note: The world average was 7.8 kg per capita in 2022.
Documented Formal Collection and Recycling Rate by Region (2022)
Regions with more mature collection and recycling systems generally report higher formal recovery rates. Europe led in 2022, while Africa remained far behind.
Label
Bar
Value
Europe
42.8%
Oceania
41.4%
Americas
30.0%
Asia
11.8%
Africa
0.7%
Max = 43% Widths: Europe = 99.53%; Oceania = 96.28%; Americas = 69.77%; Asia = 27.44%; Africa = 1.63%
Note: GEM 2024 also reports documented collection per capita of 7.53 kg in Europe, 6.66 kg in Oceania, 4.2 kg in the Americas, 0.76 kg in Asia, and 0.018 kg in Africa.
Global E-Waste by Product Type (2022)
Small equipment represented the largest share of e-waste in 2022, followed by large equipment and temperature exchange equipment. Photovoltaic panels remained a relatively small category in 2022, but are projected to grow strongly by 2030.
Note: GEM 2024 also notes that photovoltaic panel waste is projected to increase from 0.6 billion kg in 2022 to 2.4 billion kg by 2030.
Documented Formal Collection and Recycling Rate by Product Type (2022)
Formal collection and recycling rates differ substantially by equipment type. Heavier and bulkier categories, such as large equipment and temperature exchange equipment, generally achieve higher documented recycling rates than small devices and lamps.
Note: Small equipment was the biggest category by weight in 2022, but its documented formal collection and recycling rate was only 12% globally.
Material Composition of Global E-Waste (2022)
Global e-waste in 2022 contained large amounts of metals, plastics, and other materials such as minerals, glass, and composite materials. This composition helps explain why stronger recovery systems matter economically as well as environmentally.
Label
Bar
Value
Metals
31 bn kg
Plastics
17 bn kg
Other materials
14 bn kg
Max = 31 bn kg Widths: 31 = 100.00%; 17 = 54.84%; 14 = 45.16%
Note: The resource value trapped in these materials is one reason e-waste is increasingly framed as both a waste problem and a circular-economy opportunity.
Global E-Waste Policy Coverage (GEM 2024 Snapshot)
Policy coverage has improved, but it still does not match the pace of e-waste growth. The Global E-waste Monitor 2024 reports that 81 countries had a national e-waste policy, legislation, or regulation in place, and fewer countries had binding collection or recycling targets.
Label
Bar
Value
Countries with national e-waste policy, legislation, or regulation
81 countries
Countries applying extended producer responsibility (EPR)
67 countries
Countries with national e-waste collection targets
46 countries
Countries with national e-waste recycling targets
36 countries
Max = 81 countries Widths: 81 = 100.00%; 67 = 82.72%; 46 = 56.79%; 36 = 44.44%
Note: GEM 2024 says these 81 countries covered 72% of the global population.
Conclusion
The e-waste story in 2026 is increasingly clear: generation is rising fast, formal recycling is improving too slowly, and large amounts of valuable materials are still being lost. The biggest global pressure points are the sheer growth in total device waste, the weak collection rate for smaller electronics, and the large gap between policy coverage and actual recycling performance. At the same time, the data shows that better collection systems, stronger producer responsibility rules, and more repair and reuse can materially improve outcomes.
Sources
ITU & UNITAR, The Global E-waste Monitor 2024.
ITU, The Global E-waste Monitor 2024 publication page.
UNITAR, Global e-Waste Monitor 2024: Electronic Waste Rising Five Times Faster than Documented E-waste Recycling.
E-waste Monitor, The Global E-waste Monitor 2024 official release page.
All the best workstation cases provide exceptional cooling solutions for peak performance; discover which ones stand out and why they matter for your setup.
Browse our list of the 10 best office printers for medical practices and discover the reliable choices that could transform your patient care experience.
Unlock the potential of your workspace with the 10 best mini PCs for multiple monitors; discover which one will elevate your productivity to new heights.
Compare the best ASUS AI workstation desktop picks for creators, professionals, and power users who want speed, expandability, and AI-ready performance.