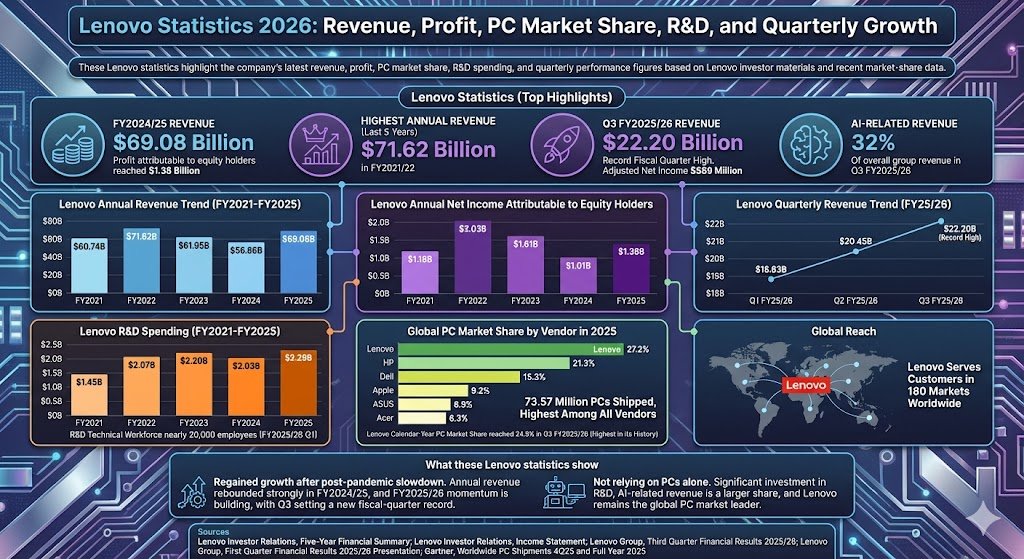
These Lenovo statistics highlight the company’s latest revenue, profit, PC market share, R&D spending, and quarterly performance figures based on Lenovo investor materials and recent market-share data.
Lenovo statistics
Lenovo statistics (Top Highlights)
Lenovo generated $69.08 billion in revenue in FY2024/25.
Profit attributable to equity holders reached $1.38 billion in FY2024/25.
Lenovo’s highest annual revenue in the last five fiscal years was $71.62 billion in FY2021/22.
Q3 FY2025/26 revenue reached a record fiscal quarter high of $22.20 billion.
Adjusted net income in Q3 FY2025/26 was $589 million.
Lenovo said AI-related revenue represented 32% of overall group revenue in Q3 FY2025/26.
Lenovo’s PC market share for calendar 2025 was 27.2%, according to Gartner.
Gartner estimated Lenovo shipped 73.57 million PCs in 2025, the highest among all vendors.
Lenovo said calendar-year PC market share reached 24.9% in Q3 FY2025/26, the highest in its history.
R&D spending reached $2.29 billion in FY2024/25.
Lenovo said its R&D technical workforce grew to nearly 20,000 employees in FY2025/26 Q1.
Lenovo says it serves customers in 180 markets worldwide.
Max = 27.2%. Widths: Lenovo 100.00%, HP 78.31%, Dell 56.25%, Apple 33.82%, ASUS 25.37%, Acer 23.16%
What these Lenovo statistics show
Lenovo’s numbers show a company that has regained growth after the post-pandemic hardware slowdown. Annual revenue rebounded strongly in FY2024/25, and the first three quarters of FY2025/26 show momentum building further, with Q3 setting a new fiscal-quarter revenue record.
The data also shows that Lenovo is not relying on PCs alone. The company continues to spend heavily on research and development, AI-related revenue is becoming a larger share of the business, and Lenovo remains the global PC market leader by vendor market share.
Get ready to explore the 10 best workstation PCs featuring Threadripper processors that redefine performance in 2026—your ultimate productivity awaits!