Semiconductor Market Statistics 2026: Market Size, Regional Demand, Product Segments, and Fab Spending
by
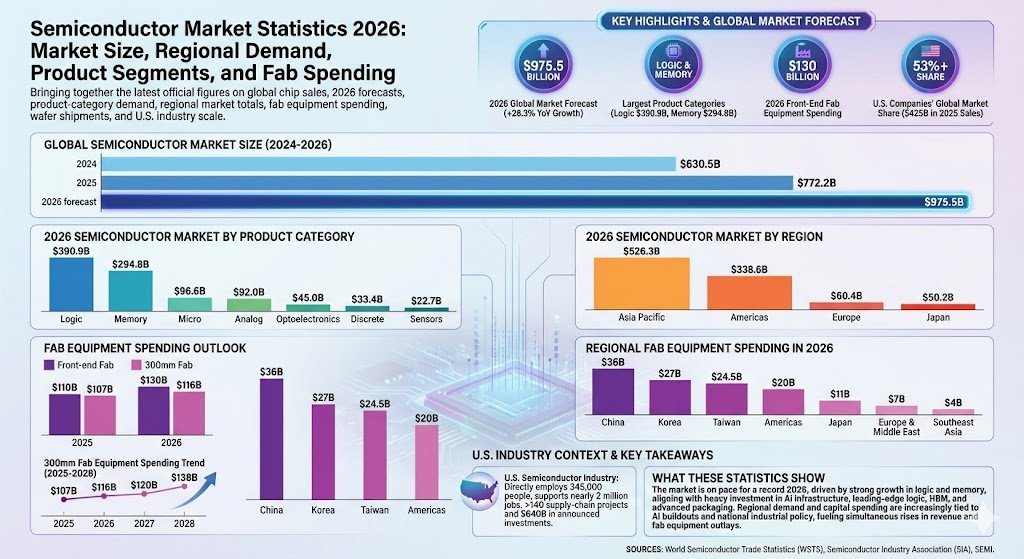
These semiconductor market statistics bring together the latest official figures on global chip sales, 2026 forecasts, product-category demand, regional market totals, fab equipment spending, wafer shipments, and U.S. industry scale.
semiconductor market statistics
Semiconductor market statistics (Top Highlights)
WSTS forecasts the global semiconductor market will reach $975.5 billion in 2026, up from $772.2 billion in 2025 and $630.5 billion in 2024.
That implies 26.3% year-over-year growth in 2026 after 22.5% growth in 2025.
Logic is projected to be the largest semiconductor product category in 2026 at $390.9 billion.
Memory is forecast to reach $294.8 billion in 2026, making it the second-largest product segment.
Asia Pacific is expected to remain the largest regional semiconductor market in 2026 at $526.3 billion.
The Americas are forecast to reach $338.6 billion in 2026, ahead of Europe at $60.4 billion and Japan at $50.2 billion.
WSTS said the computer end-market grew by more than 60% in 2025, while government demand rose 15% and industrial demand increased 5%.
SIA reported January 2026 global semiconductor sales of $82.5 billion, up 3.7% month over month and 46.1% year over year.
SEMI expects front-end fab equipment spending to rise from $110 billion in 2025 to $130 billion in 2026.
SEMI projects 300mm fab equipment spending at $107 billion in 2025, $116 billion in 2026, $120 billion in 2027, and $138 billion in 2028.
SEMI said worldwide silicon wafer shipments increased 5.8% in 2025 to 12,973 million square inches, while wafer revenue was $11.4 billion.
SIA said U.S.-headquartered semiconductor companies account for over 53% of global market share, with $425 billion in 2025 sales.
The U.S. semiconductor industry directly employs 345,000 people and supports nearly 2 million additional U.S. jobs.
SIA said more than 140 U.S. semiconductor supply-chain projects and $640 billion in announced investments are now on the books.
Max = $36B. Widths: China 100.00%, Korea 75.00%, Taiwan 68.06%, Americas 55.56%, Japan 30.56%, Europe & Middle East 19.44%, Southeast Asia 11.11%
What these semiconductor market statistics show
The semiconductor market is on pace for another record year in 2026, with the strongest revenue concentration still centered in logic and memory. That pattern lines up with where the industry is spending its money: leading-edge logic, AI infrastructure, HBM, 2nm ramps, advanced packaging, and new 300mm capacity.
Regional demand and capital spending also show that the market is no longer being discussed only in terms of cyclical recovery. It is increasingly tied to AI buildouts, national industrial policy, and supply-chain localization, which is why both market revenue and fab-equipment outlays are rising at the same time.
Sources
World Semiconductor Trade Statistics, Autumn 2025 Forecast Summary and March 2026 full-year 2025 market results
Semiconductor Industry Association, March 2026 market data release for January 2026 sales
Semiconductor Industry Association, March 4, 2026 Senate testimony on the U.S. semiconductor industry
SEMI, March 25, 2025 World Fab Forecast press release
SEMI, October 8, 2025 300mm Fab Outlook press release
SEMI, February 10, 2026 annual silicon wafer shipments and revenue results