Dell Statistics 2026: Revenue, PC Market Share, AI Server Sales, and Segment Data
by
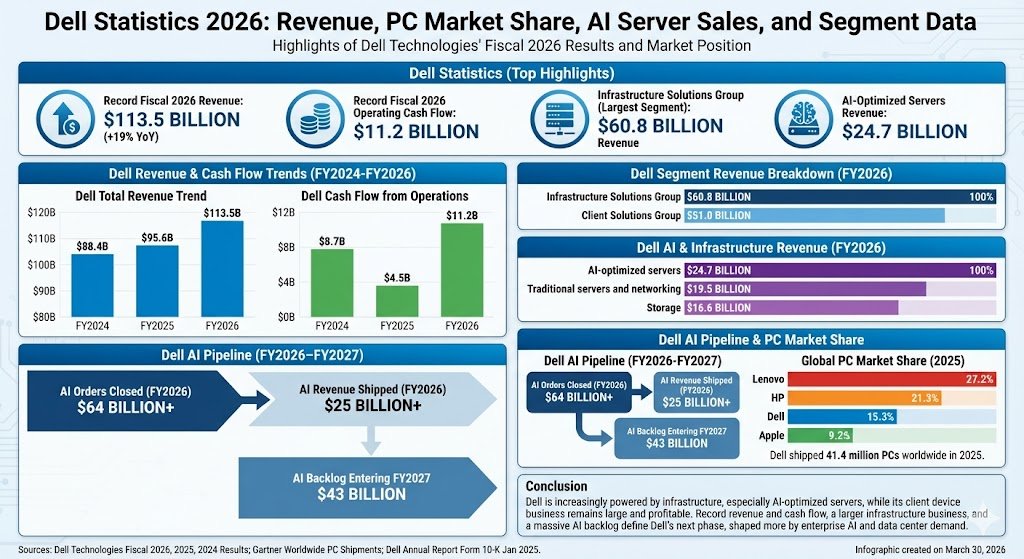
These Dell statistics highlight the latest available company and industry figures, with a focus on Dell Technologies’ fiscal 2026 results for the year ended January 30, 2026. The numbers below cover revenue, operating income, cash flow, segment performance, AI infrastructure growth, and Dell’s position in the global PC market.
Dell statistics
Dell statistics (Top Highlights)
Dell Technologies reported record fiscal 2026 revenue of $113.5 billion, up 19% year over year.
Fiscal 2026 operating income reached $8.1 billion, while diluted EPS rose to $8.68.
Cash flow from operations climbed to a record $11.2 billion in fiscal 2026.
Infrastructure Solutions Group generated $60.8 billion in fiscal 2026 revenue, making it Dell’s largest business segment.
Client Solutions Group generated $51.0 billion in fiscal 2026 revenue.
Dell’s AI-optimized servers brought in $24.7 billion in fiscal 2026 revenue.
Dell said it closed more than $64 billion in AI-optimized server orders in fiscal 2026 and entered fiscal 2027 with a record $43 billion backlog.
According to Gartner, Dell shipped 41.4 million PCs worldwide in 2025 and held a 15.3% market share.
Dell shipped 11.8 million PCs in the fourth quarter of 2025 alone, with a 16.5% share of the global PC market.
Dell’s latest annual report said the company had approximately 108,000 employees as of January 31, 2025.
Dell revenue statistics
Dell’s total revenue has grown sharply over the last three reported fiscal years, rising from $88.4 billion in fiscal 2024 to $113.5 billion in fiscal 2026. That increase was driven largely by infrastructure demand, especially AI-optimized servers.
Label
Bar
Value
FY2024
$88.4B
FY2025
$95.6B
FY2026
$113.5B
Max = $113.5B. Widths: FY2024 77.88%, FY2025 84.17%, FY2026 100.00%
Dell cash flow statistics
Dell’s cash generation was volatile between fiscal 2024 and fiscal 2026, but the latest year was a breakout. Cash flow from operations reached $11.2 billion in fiscal 2026, well above both fiscal 2024 and fiscal 2025.
Label
Bar
Value
FY2024
$8.7B
FY2025
$4.5B
FY2026
$11.2B
Max = $11.2B. Widths: FY2024 77.57%, FY2025 40.42%, FY2026 100.00%
Dell segment revenue statistics
Dell’s business is now split fairly evenly between infrastructure and client devices, but infrastructure pulled ahead in fiscal 2026. Infrastructure Solutions Group reached $60.8 billion in revenue, compared with $51.0 billion for Client Solutions Group.
Label
Bar
Value
Infrastructure Solutions Group
$60.8B
Client Solutions Group
$51.0B
Max = $60.8B. Widths: Infrastructure Solutions Group 100.00%, Client Solutions Group 83.82%
Dell AI and infrastructure statistics
AI hardware was the biggest growth engine inside Dell’s infrastructure business in fiscal 2026. AI-optimized servers alone generated $24.7 billion in revenue, ahead of traditional servers and networking at $19.5 billion and storage at $16.6 billion.
Label
Bar
Value
AI-optimized servers
$24.7B
Traditional servers and networking
$19.5B
Storage
$16.6B
Max = $24.7B. Widths: AI-optimized servers 100.00%, Traditional servers and networking 79.05%, Storage 67.38%
Dell AI order statistics
Dell’s AI infrastructure pipeline also expanded dramatically in fiscal 2026. The company said it closed more than $64 billion in AI-optimized server orders, shipped more than $25 billion during the year, and entered fiscal 2027 with a record backlog of $43 billion.
Label
Bar
Value
AI orders closed
$64B+
AI revenue shipped
$25B+
AI backlog entering FY2027
$43B
Max = $64B. Widths: AI orders closed 100.00%, AI revenue shipped 39.06%, AI backlog entering FY2027 67.19%
Dell PC market share statistics
In the broader PC market, Dell remained one of the world’s top vendors in 2025. Gartner estimated Dell shipped 41.4 million PCs for the full year and held a 15.3% global market share, behind Lenovo and HP.
Label
Bar
Value
Lenovo
27.2%
HP
21.3%
Dell
15.3%
Apple
9.2%
Max = 27.2%. Widths: Lenovo 100.00%, HP 78.31%, Dell 56.25%, Apple 33.82%
What these Dell statistics show
Dell is no longer just a PC company story. The latest figures show a business increasingly powered by infrastructure, especially AI-optimized servers, while its client device business remains large and profitable enough to keep Dell among the top global PC vendors.
The most important shift in the numbers is scale. Dell posted record company revenue, record cash flow, and a much larger infrastructure business in fiscal 2026, while also building a sizeable AI backlog. That combination suggests Dell’s next phase is being shaped more by enterprise AI and data center demand than by consumer PCs alone.
Sources
Dell Technologies, Fourth Quarter and Full-Year Fiscal 2026 Results, February 26, 2026
Dell Technologies, Fourth Quarter and Full-Year Fiscal 2025 Financial Results, February 27, 2025
Dell Technologies, Fourth Quarter and Full-Year Fiscal 2024 Financial Results, February 29, 2024
Gartner, Worldwide PC Shipments Increased 9.3% in Fourth Quarter of 2025 and 9.1% for the Full Year, January 20, 2026
Dell Technologies Annual Report on Form 10-K for the fiscal year ended January 31, 2025
Navigate the crowded webcam market in 2026 to discover the top 10 4K options that promise unmatched video clarity for every user—are you ready to elevate your streaming game?
Check out our top 10 docking stations with storage bays that promise unparalleled convenience and performance; discover which one suits your needs best!
Navigate the top 10 power stations featuring pure sine wave technology for reliable energy solutions that promise stability and efficiency—discover which ones are worth your investment.