Lenovo Statistics 2026: Revenue, Profit, PC Market Share, R&D, and Quarterly Growth
by
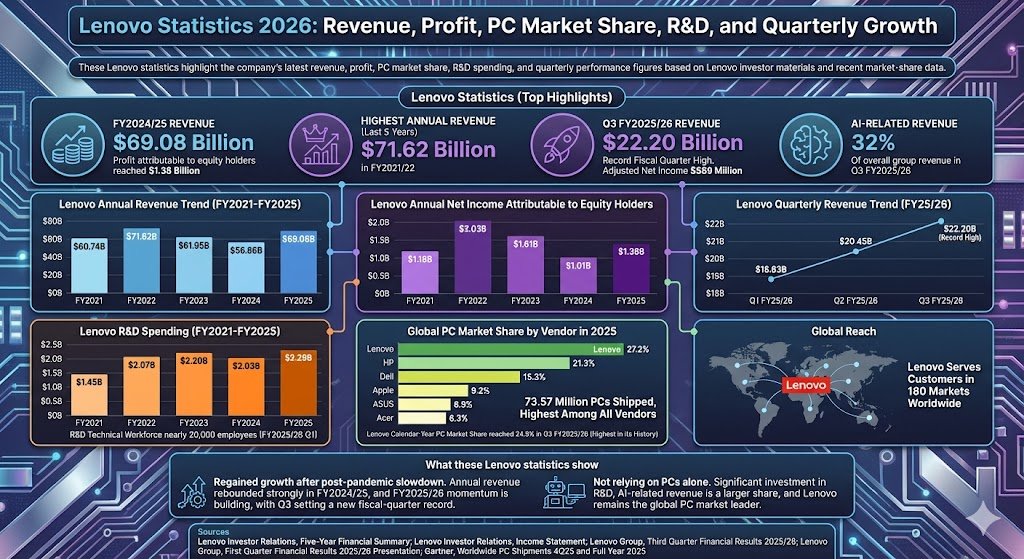
These Lenovo statistics highlight the company’s latest revenue, profit, PC market share, R&D spending, and quarterly performance figures based on Lenovo investor materials and recent market-share data.
Lenovo statistics
Lenovo statistics (Top Highlights)
Lenovo generated $69.08 billion in revenue in FY2024/25.
Profit attributable to equity holders reached $1.38 billion in FY2024/25.
Lenovo’s highest annual revenue in the last five fiscal years was $71.62 billion in FY2021/22.
Q3 FY2025/26 revenue reached a record fiscal quarter high of $22.20 billion.
Adjusted net income in Q3 FY2025/26 was $589 million.
Lenovo said AI-related revenue represented 32% of overall group revenue in Q3 FY2025/26.
Lenovo’s PC market share for calendar 2025 was 27.2%, according to Gartner.
Gartner estimated Lenovo shipped 73.57 million PCs in 2025, the highest among all vendors.
Lenovo said calendar-year PC market share reached 24.9% in Q3 FY2025/26, the highest in its history.
R&D spending reached $2.29 billion in FY2024/25.
Lenovo said its R&D technical workforce grew to nearly 20,000 employees in FY2025/26 Q1.
Lenovo says it serves customers in 180 markets worldwide.
Max = 27.2%. Widths: Lenovo 100.00%, HP 78.31%, Dell 56.25%, Apple 33.82%, ASUS 25.37%, Acer 23.16%
What these Lenovo statistics show
Lenovo’s numbers show a company that has regained growth after the post-pandemic hardware slowdown. Annual revenue rebounded strongly in FY2024/25, and the first three quarters of FY2025/26 show momentum building further, with Q3 setting a new fiscal-quarter revenue record.
The data also shows that Lenovo is not relying on PCs alone. The company continues to spend heavily on research and development, AI-related revenue is becoming a larger share of the business, and Lenovo remains the global PC market leader by vendor market share.